At the October 2020 AES Convention, Dolby Laboratories researchers Aaron Master and Hannes Muesch presented their work on “A Model to Predict the Impact of Dialog Enhancement or Mix Ratio on a Large Audience”. To help somebody (like me) who may not be an audio researcher understand the Convention e-Brief, they helped answer a few questions to explain their area of research and how it helps us think about creating better audio.
Before diving in, can you tell me a bit more about yourselves?
Dr. Aaron Master: I serve as Manager of Sound Technology in the Office of the CTO at Dolby. As an engineer and lifelong musician, I have a passion for audio signal processing; this was the focus of my graduate work at CCRMA at Stanford University and has continued to be for much of my career. My research interests include dialog enhancement, spatial audio, low-latency source separation, audio coding and audio accessibility.
Dr. Hannes Müsch: I am part of the Sound Technology Research team here at Dolby. I got interested in modeling speech perception when working on my PhD, where I built a model that used statistical decision theory to predict speech intelligibility. I’ve stayed involved with prediction and measurement of speech understanding ever since, including authoring an ITU Recommendation for measuring speech intelligibility and serving on the standards committee for the ANSI S3.5 ‘Speech Intelligibility Index’.
Explain like I’m five, what is Dialog Enhancement?
“Dialog enhancement” is a feature that lets you turn up the volume of just the dialog on a TV show or movie without raising the volume overall. Say you’re watching a sports program. You press a “dialog enhancement” button and – “voila!” – the sports announcer’s voice is now louder than the crowd noise. This can lead to reduced effort in dialog understanding.
Ok, but how does this work behind the scenes?
Dialog Enhancement (DE) is a relatively easy feature to build if you have access to a separate dialog track; the DE system just boosts that track. But most of the time, we don’t have access to that track, meaning that the consumer electronics system must estimate it from the original mix which typically contains music, crowd noise and or other effects. This is a much harder source separation problem — like trying to take the dressing off of a salad that’s already been mixed. A high quality DE system allows for a high quality dialog-boosted signal that preserves the integrity of the original recording.
Why should I care about dialog enhancement or listening effort?
Some people struggle to understand dialog in a typical TV show or movie, meaning that they must exert significant mental effort. When listeners have to exert too much effort to understand they may lose interest, feel forced to add subtitles, or stop consuming the content altogether. It is important to understand that different people have different tolerance for background sounds. For example, people with some degree of hearing loss, as most of us develop as we get older, or people whose first language isn’t English, struggle to understand content at a mix ratio that young, native listeners understand effortlessly. Dialog enhancement is a feature that allows listeners to choose their dialog level to suit their specific needs or preference.
What do you mean by mix ratio? Is that like signal to noise ratio?
By “mix ratio,” we are referring to the ratio of dialog to music and effects in a piece of content. It’s a bit like a “signal to noise ratio,” except in this case, the dialog, music and effects are all intentionally included as part of a piece of content. Nonetheless, music and effects can compete with dialog when it comes to listening effort.
How does mix ratio impact listening effort?
For a given content item, some listeners understand dialog effortlessly. For them, increasing the mix ratio will not reduce listening effort further – although some prefer it. Other listeners have severe hearing impairments and can only understand a fraction of what is said. Their ability to understand improves until all background sounds are removed. Most of the audience will be somewhere between these extremes.
You made a model to predict listening effort. What are the basic for how that works?
Our model builds on the work of others; combining years worth of peer-reviewed, published research. Researchers at some of the top universities have worked to understand the relationship between basic measures of hearing loss and the ability to understand speech in noise. So far they are unable to make accurate predictions for any one individual, but their research has discovered the statistical relationships between hearing loss and listening effort. At the same time, we know from large epidemiological studies the distribution of hearing loss in the population. Our model combines these two sources of information. For example, the model can predict how many men in the age range 60-64 will have to exert various levels of effort to understand a piece of content.
How does this model relate to dialog enhancement?
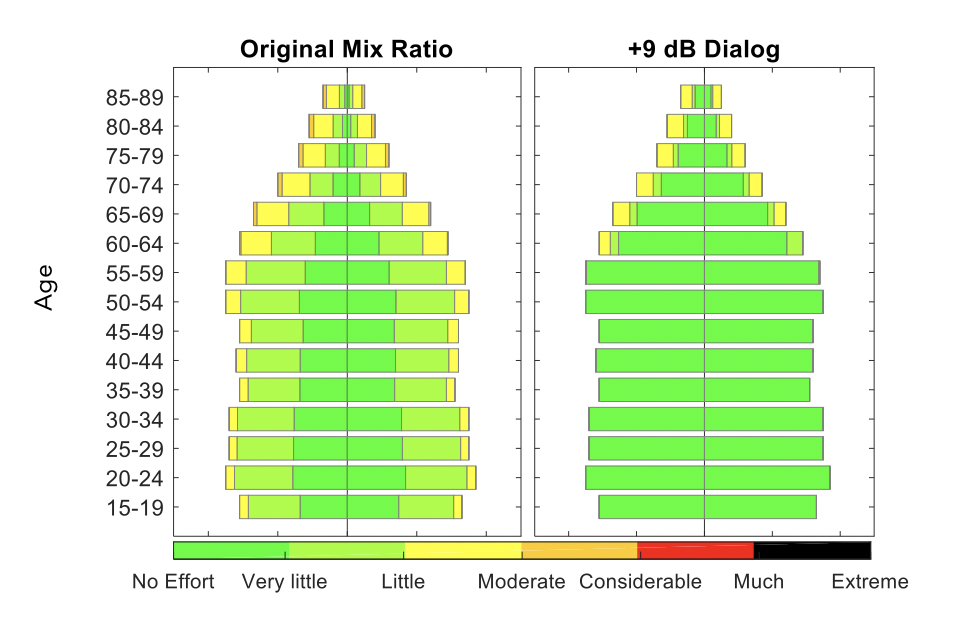
The model shows us how much effort an audience will need to exert to understand content. And the same model allows us to simulate a change in the relative dialog level – which is what dialog enhancement allows – and measure the result. We show that boosting dialog by 9 dB (making dialog a bit less than twice as loud) leads to a substantial reduction in listening effort for many listeners for typical content examples.
You mention TV and movies in relation to dialog enhancement, is this only relevant for big Hollywood productions?
No. People consume all kinds of media – podcasts, recorded lectures, teleconferencing, etc – all of which can be characterized by the features in our model. In the brief, we chose real-world examples of sports and documentary TV content, but the model could be applied to other types of media as well.
What exactly does the model output? Can you give an example?
Since the model outputs thousands of predictions for listening effort at a time, we needed a way to make that easy to understand at a glance. To do this, we had the model output color-coded population pyramid plots, where different colors represent different levels of effort needed for various population groups. An example is included here. It shows results on a sports content item with commentary over a background of crowd noise, and assumes the entire U.S. population is the audience.
Explanation:
- Results for the original mix are shown in the left pyramid plot, and results for when dialog is boosted by 9 dB are shown in the right pyramid plot.
- The center line in each pyramid splits gender, with female extending to the left and male extending to the right.
- The overall length of the bars indicate the proportion of the total US population in that group. (Narrower bars towards the top of each plot are due to increased mortality with advanced age.)
- Colors indicate the effort required to understand speech in the mix. Larger color segments indicate more people in the demographic predicted to be at the shown level of effort.
How can I learn more?
You can find the brief published in the AES e-Library:
https://www.aes.org/e-lib/browse.cfm?elib=20923
There are a number of additional citations that can be worth a read for anybody that has interest in a deeper dive on the subject.


