


If you plan to have multiple participants in your WebRTC calls then you will probably end up using a Selective Forwarding Unit (SFU).
SFUs can be used to describe a video routing device or the routing technology itself. An SFU is capable of receiving multiple media streams and decide which of these media streams should be sent to which participants.
Capacity planning for SFUs can be difficult — there are estimates to be made for where they should be placed, how much bandwidth they will consume, and what kind of servers you need.
To help network architects and WebRTC engineers make some of these decisions, Dr. Alex Gouaillard and his team at CoSMo Software and Millicast put together a load test suite to measure load vs. video quality.
They published their results for all of the major open source WebRTC SFUs. This testing used the Karoshi Interoperability Testing Engine (KITE) Google funded and users on webrtc.org to show interoperability status.
The team also developed a machine learning based video quality assessment framework optimized for real time communications scenarios.
First an important word of caution — asking what kind of SFU is best is kind of like asking what car is best. If you only want fast then you should get a Formula 1 car, but that won’t help you get the kids to school. Vendors never get excited about these kinds of tests because it boils down their functionality into just a few performance metrics. These metrics may not have been a major part of their design criterion and a lot of times they just aren’t that important.
For WebRTC SFUs in particular, just because you can load a lot of streams on an SFU, there may be many reasons for not doing that, including resiliency, user behavior, and cost optimization. Also, load tests don’t take a deep look at the end-to-end user experience, ease of development, or all the other functional elements that go into a successful service. Lastly, a published report like this represents a single point in time — these systems are always improving so results change.
That being said, I personally have had many cases where I wish I had this kind of data when building out cost models. Dr. Alex and his team have done a lot of thorough work here and this is great sign for maturity in the WebRTC open source ecosystem. I personally reached out to each of the SFU development teams mentioned here to ensure they were each represented fairly. This test setup is certainly not perfect, but I do think it will be a useful reference for the community.
Please read on for Alex’s test setup and analysis summary:

One recurring question on the discuss-webrtc mailing list is “What is the best SFU?”
This invariably produces a response of “Mine obviously” from the various SFU vendors and teams. Obviously, they cannot all be right at the same time!
You can check the full thread. Chad Hart, then with Dialogic answered kindly recognizing the problem and expressed a need:
“In any case, I think we need a global (same applied to all) reproducible and unbiased (source code available, and every vendor can tune their installation if they want) benchmark, for several scalability metrics.”
Three years later my team and I have built such a benchmark system. I will explain how this system works and show some of our initial results below.
Several SFU vendors provide load testing tools. Janus has Jattack. Jitsi has jitsi-hammer and even published some of their results. Jitsi in particular has done a great job with transparency and provides reliable data and enough information to reproduce the results.
However, not all vendors have these tools and fewer still make them fully publicly available. In addition, each tool is designed to answer slightly different questions for their own environments such as:
- How many streams can a single server instance of chosen type and given bandwidth limit handle?
- How many users can I support on the same instance?
- How many users can I support in a single conference?
- Etc….
There was just no way to make a real comparative study — one that is independent reproducible, and unbiased. The inherent ambiguity also opened the door for some unsavory behavior from some who realized they could get away with any claim because no one could actually check them. We wanted to produce some results that one does not have to take on faith and that could be peer-reviewed.
To have a good answer to “What is the best SFU?” you need to explain what you are planning to use it for.
We chose to work on the two use cases that seemed to gather the most attention, or at least those which were generating the most traffic on discuss-webrtc:
- Video conferencing — many to many, all equals, one participant speaking at a time (hopefully) ,
- Media streaming — one-to many, unidirectional
Most video conferencing questions are focused on single server instance. Having 20+ people in a given conference is usually plenty for most. Studies like this one show that in most social cases most of the calls are 1–1, and the average is around 3. , This configuration fits very well a single small instance in any public cloud provider (as long as you get a 1Gbps NIC). You can then use very simple load balancing and horizontal scalability techniques since the ratio of senders to viewers is rarely high. Media streaming, on the other hand, typically involves streaming from a single source to thousands or tens of thousands of viewers. This requires a multi-server hierarchy.
We wanted to accommodate different testing scenarios and implement them in the same fashion across several WebRTC Servers so that the only difference is the system being tested, and the results are not biased. For purposes of this post I will focus on the video conferencing scenario.
In collaboration with Google and many others, we developed , a testing engine that would allow us to support all kinds of clients — browsers and native across mobile or desktop — and all kind of test scenarios easily. It is used to test WebRTC implementation everyday across browsers as seen on

Selecting a test client
Load testing is typically done with a single client to control for client impacts. Ideally you can run many instances of the test client in parallel in a single virtual machine (VM). Since this is WebRTC, it makes sense to use one of the browsers. Edge and Safari are limited to a single process, which does not make they very suitable. Additionally, Safari only runs MacOS or iOS, which only runs on Apple hardware. It is relatively easy to spawn a million VMs on AWS if you’re running Windows or Linux. It’s quite a bit more difficult, and costly, to setup one million Macs, iPhones, or iPads for testing (Note, I am still dreaming though).
That leaves you with Chrome or Firefox which allow multiple instances just fine. It is our opinion that the implementation of webdriver for Chrome is easier to manage with fewer flags and plugins (i.e. H264) to handle, so we chose to use Chrome.
Systems Under Test
We tested the following SFUs:
To help make sure each SFU showed its best results, we contacted the teams behind each of these projects. We offered to let them set up the server themselves or connect to the servers and check-up their settings. We also shared the results so they could comment. That made sure we properly configured each system to handle optimally for our test.
Interestingly enough, during the life of this study we found quite a few bugs and worked with the teams to improve their solutions. This is discussed more in detail in the last section.
Test Setup
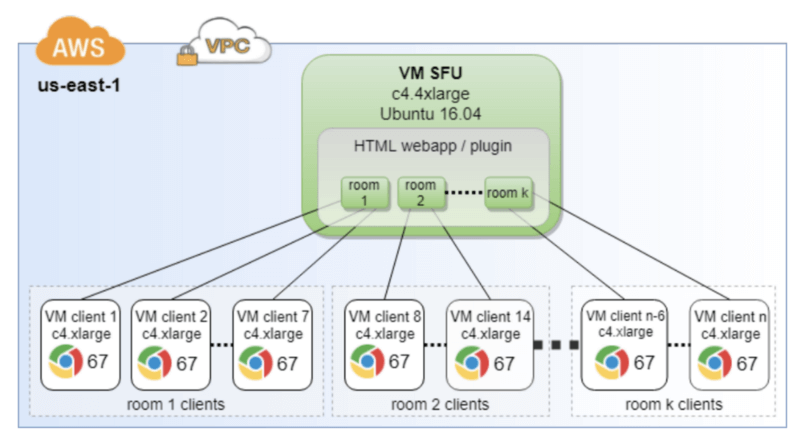
We used the following methodology to increase traffic to a high load. First we populated each video conference rooms with one user at a time until it reached 7 total users. We repeated this process until the total target number of users was reached. close to 500 simultaneous users.
The diagram below shows the elements in the testbed:

Metrics
Most people interested in scalability questions will measure the CPU, RAM, and bandwidth footprints of the server as the “load” (streams, users, rooms…) ramps up. That is a traditional way of doing things that supposes that the quality of the streams, their bitrate… all stay equal.
WebRTC’s encoding engine makes this much more complex. WebRTC includes bandwidth estimation, bitrate adaptation and overall congestion control mechanism, one cannot assume streams will remain unmodified across the experiment. In addition to the usual metrics, the tester also needs to record client-side metrics like sent bitrate, bandwidth estimation results and latency. It is also important to keep an eye on the video quality, as it can degrade way before you saturate the CPU, RAM and/or bandwidth of the server.
On the client side, we ended up measuring the following:
- Rate of success and failures (frozen video, or no video)
- Sender and receiver bitrates
- Latency
- Video quality (more on that in the next section)
Measuring different metrics on the server side can be as easy as pooling the getStats API yourself or integrating a solution like callstats.io. In our case, we measured:
- CPU footprint,
- RAM footprint,
- Ingress and egress bandwidth in and out,
- number of streams,
- along with a few of other less relevant metrics.
The metrics above were not published in the Scientific article because of space limitation, but should be released in a subsequent Research Report.
All of these metrics are simple to produce and measure with the exception of video quality. What is an objective measure of video quality? Several proxies for video quality exist such as Google rendering time, received frames, bandwidth usage, but none of these gave an accurate measure.
Ideally a video quality metric would be visually obvious when impairments are present. This would allow one to measure the relative benefits of resilient techniques, such as like Scalable Video Coding (SVC), where conceptually the output video has a looser correlation with jitter, packet loss, etc. than other encoding methods. See the below video from Agora for a good example of a visual comparison:
https://www.youtube.com/watch?v=M71uov3OMfk
After doing some quick research on a way to automate this kind of visual quality measurement, we realized that nobody had developed a method to assess the video quality as well as a human would in the absence of reference media with a real-time stream. So, we went on to develop our own metric leveraging Machine Learning with neural networks. This allowed for real-time, on-the-fly video quality assessment. As an added benefit, it can be used without recording customer media, which is a sometimes a legal or privacy issue.
The specifics of this mechanism is beyond the scope of this article but you can read more about the video quality algorithm . The specifics of this AI-based algorithm have been submitted for publication and will be made public as soon as it is accepted.
We set up the following five open-source WebRTC SFUs, using the latest source code downloaded from their respective public GitHub repositories (except for Kurento/OpenVidu, for which the Docker container was used):
Each was setup in a separate but identical Virtual Machine and with default configuration.
Disclaimers
First a few disclaimers. All teams have seen and commented on the result of their SFUs.
The Kurento Media Server team is aware that their server is currently crashing early and we are working with them to address this. On Kurento/OpenVidu, we tested max 140 streams (since it crashes so early).
In addition, there is a known bug in libnice, which affected both Kurento/OpenVidu and Janus during our initial tests. After a libnice patch was applied as advised by the Janus team, their results significantly improved. However, the re-test with the patch on Kurento/OpenVidu actually proved even worse. Our conclusion was that there are other issues with Kurento. We are in contact with them and working on fixes so, the Kurento/OpenVidu results might improve soon.
The latest version of Jitsi Videobridge (up to the point of this publication) always became unstable at exactly 240 users. The Jitsi team is aware of that and working on the problem. They have however pointed out that their general advice is to rely on horizontal scaling with a larger number of smaller instances as described . Note that a previous version (as two months ago) did not have these stability issues but did not perform as well (see more on this in the next section). We chose to keep version 0.1.1077 as it included made simulcast much better and improved the results significantly (up to 240 participants, that is).
Also note nearly all of these products have had version releases since testing. Some have made improvements since the test results shown here.
Measurements
As an reference point, we chose one of the usual video test sequences, and computed its video quality score using several video quality assessment metrics:
- SSIM — a common metric that compares the difference between a distorted image and its original
- VMAF — an aggregate measure of a few metrics used and developed by Netflix
- NARVAL — our algorithm which does not require a reference
Note the relationship between quality score and bitrate is not linear. If you slowly decrease the bandwidth from the reference value (1.7Mbps) the quality score only decreases slightly until it hits a low bitrate threshold and then decreases more drastically. To lose 10% of the perceived video quality, you need to reduce the bandwidth to 250Kbps according to WMAF, or even 150k according to SSIM, and 100k according to NARVAL.
Tests on the SFUs showed the same pattern. Image 2 gives the bitrate as a function of the number of participants for each SFU. One can see here that WebRTC’s congestion control algorithms kick in early (at around 250 participants) to maintain bitrate. However, Image 3 shows that the latency increases more linearly. Despite decreasing bandwidth and increasing latency, the video quality metric shown in Image 4 only reports quality degradation much later around when the bandwidth goes below 200k. That shows again that bit rate and latency are not good proxies for Video Quality.
Beyond the results themselves presented above, what is interesting is to see the progress in the results triggered by this study. Just getting visibility has allowed the respective teams to address the most egregious problems.
Then you can also observe that Janus was very quickly limited. They had identified this bottleneck in an external library, and a possible solution, but had never really assessed the true impact. One can clearly see the difference between the graphs in this section (first runs), and the graphs in the previous section (latest results), were Janus seems to perform the best.
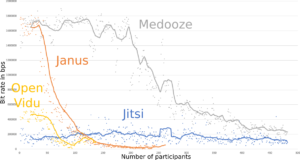
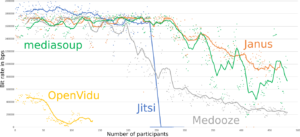
Bitrate as a function of the load.
Before (left) and after (right) application of patches to Janus and Jitsi. We also added mediasoup results (in green). Medooze and Kurento/OpenVidu results are the same in both plots as no better results could be generated the second time around.
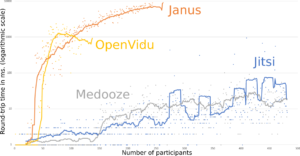
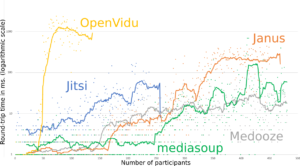
RTT, or latency, as a function of the load (logarithmic scale).
Before (left) and after (right) application of patches to Janus and Jitsi. We also added mediasoup results (in green). Medooze and Kurento/OpenVidu results come from the same dataset.
Finally, one reviewer of our original article pointed to the fact that Medooze by Sergio Garcia Murillo’s, a CoSMo employee, ended up on top of our study, hinting to a possible bias caused by a conflict of interest. We went to great efforts to conduct all of our tests transparently without bias. I think it is refreshing to see that in the latest results several SFUs end up being on par or better than Medooze, removing the final worry some might have. It was good news for the Medooze team too — now they know what they have to work on (like improvements made in Medooze 0.46) and they have a tool to measure their progress.
We hope we have shown that unbiased comparative testing of SFUs is now relatively easy to achieve thanks to KITE and a few other tools recently developed by CoSMo in collaboration with the authors of the WebRTC ecosystem. We will continue working with the different open Source WebRTC SFUs vendors to help them improve their software. We are planning to make as much as possible of the code used to generate those results public, and in any case, to provide access for public researchers to the tool, in a non-profit way. Eventually we would like to host those results as a “live” web page, where new results would be made available as new versions of the software are made available.
See the and summary slides presented this week at the IIT Real-Time Communications Conference.
Originally published at https://webrtchacks.com


")