


Client-side analytics are a powerful tool for understanding app users and their quality of experience. This is especially true for streaming, where the latency, quality, and stability of playback all impact user engagement and retention.
To help provide insight into how users are “experiencing” a broadcast, Dolby Millicast supports client-side analytics for reporting, diagnosing, and understanding playback.
In this guide, we’ll explore how to enable client-side reporting using Datazoom and how to pipe this data from the client into third-party data visualizers like Datadog.
Connecting Datazoom to the Millicast Web SDK
Note: Before proceeding it is recommended you are familiar with our platform and WebSDK.
Datazoom supports retrieving data from the Millicast SDK in two ways:
- From the player. This is for tracking player events such as pausing or adjusting the volume.
- From the Millicast WebRTC stats. This is for tracking WebRTC-specific stats such as round trip time, packet loss, and network jitter.
In addition to player and WebRTC stats, Datazoom also records and normalizes device and platform data such as screen resolution, browser, OS, and geo-location.
To get started, we first must log into our Datazoom dashboard and create a collector. In this example, we’re using the Millicast Web SDK and the default HTML5 video player to build our app so we should select the HTML5 Media Player connector. Once created, navigate into the newly created connector and retrieve your Collection Key positioned under your collector name:
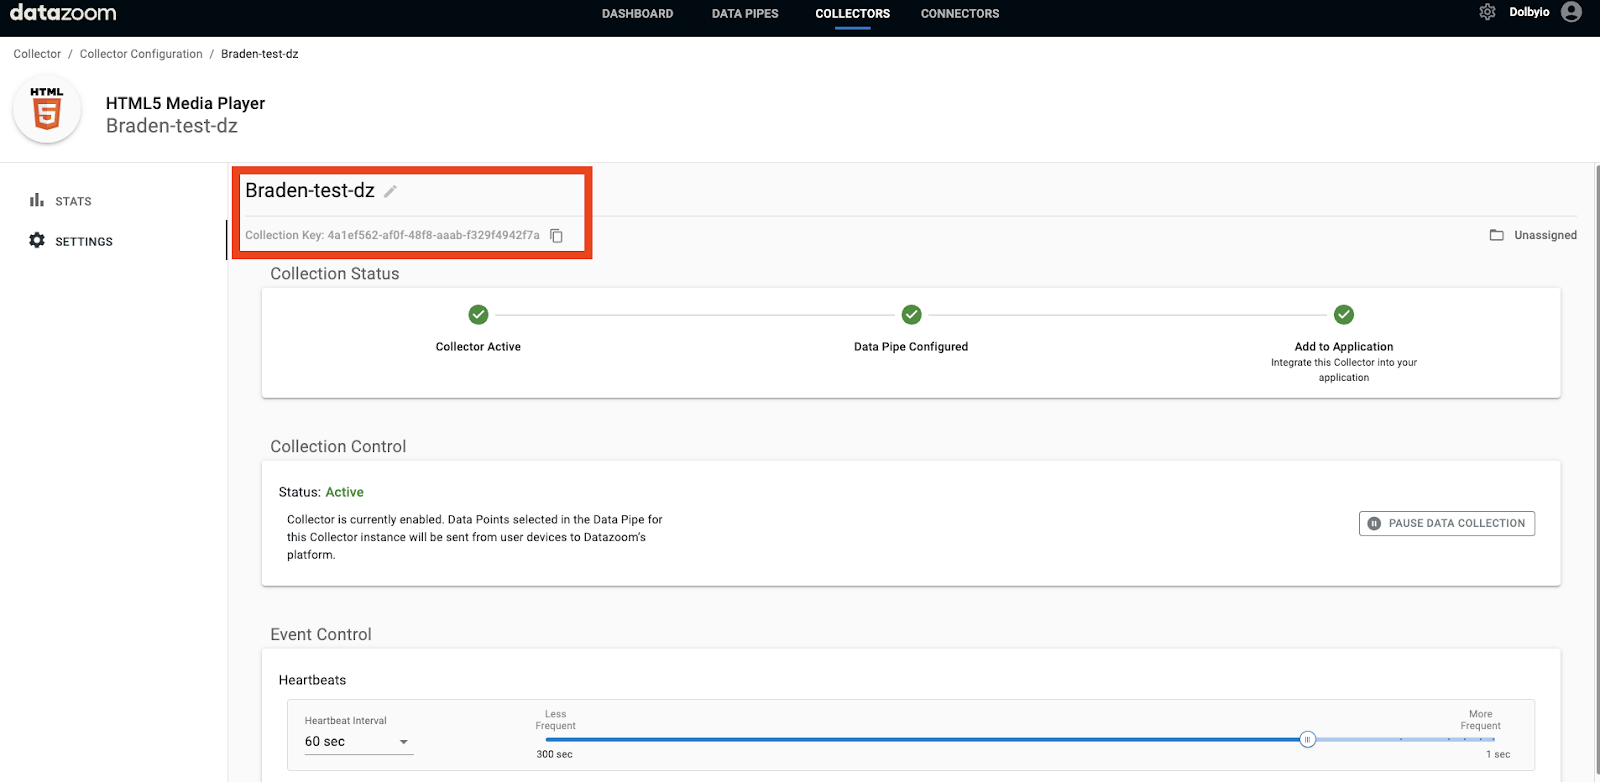
Next, we add this Collection Key to a script tag in the <Head> of our project’s HTML file.
<script
src="https://platform.datazoom.io/beacon/v1/config?configuration_id=YOUR_KEY"></script>
Once you’ve configured the Datazoom script tag, navigate to your project’s JavaScript where you interface with the app’s player.
Call the Datazoom createContext function on the video player to initialize player data collection. In this case, we’ve just embedded the default HTML video player in the HTML of our web app, which we then retrieve and pass to Datazoom.
let video = document.getElementById("videoPlayer");
 video.srcObject = stream;
 video.hidden = false;
 video.autoplay = true;
 window.datazoom.createContext(video);
To collect the WebRTC Stats, we first must initialize the WebRTC stats in the Millicast SDK. This is done by initializing the stats and creating an event that triggers wherever stats are updated. When updated the event will send the metadata to Datazoom.
millicastView.webRTCPeer.initStats();
millicastView.webRTCPeer.on("stats", (stats) => {
console.log(stats);
window.datazoom.setMetadata({ webRTCStats: stats });
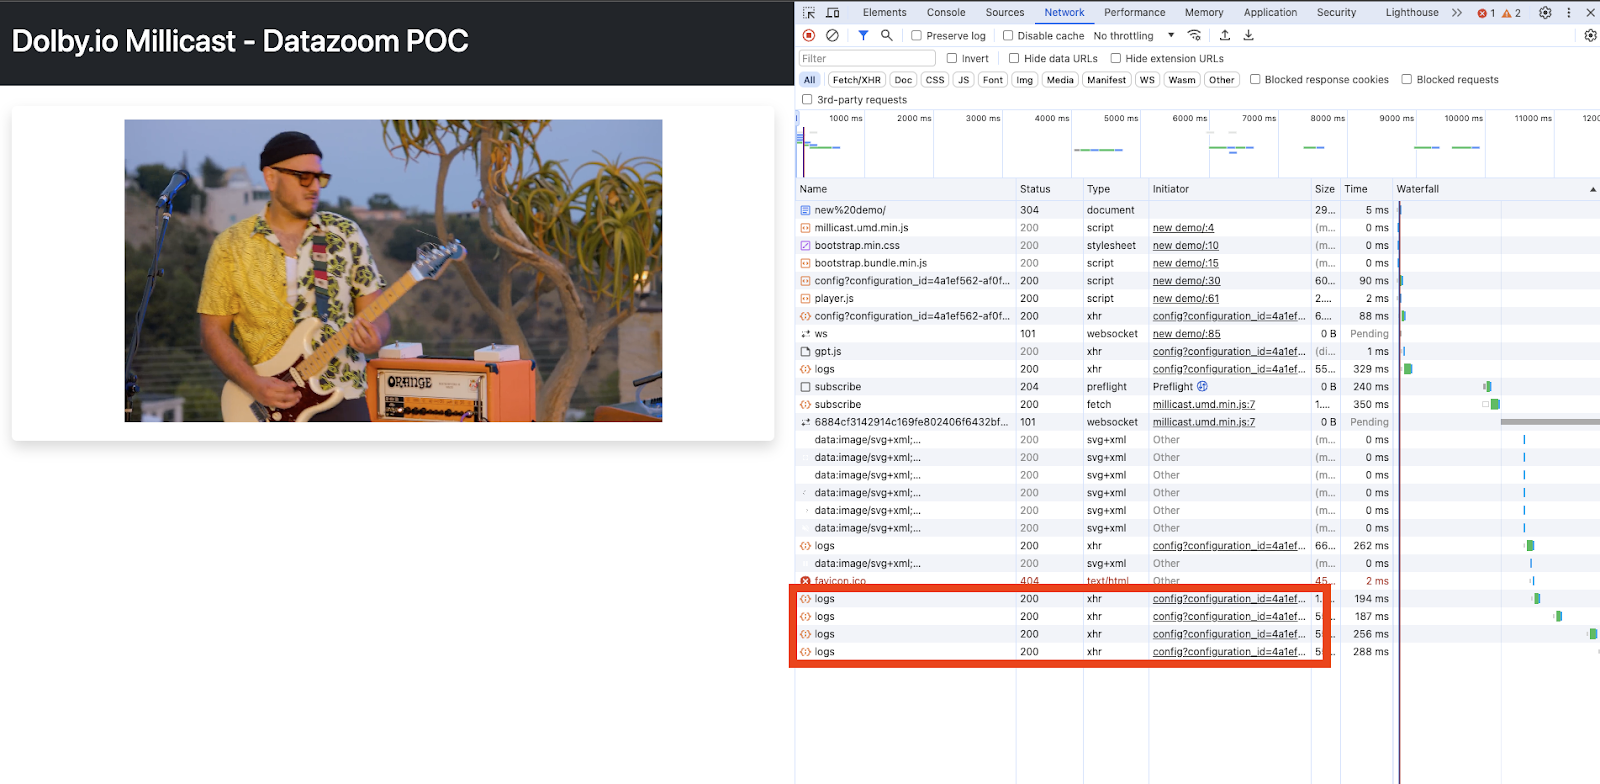
});From here the data is ready to be delivered to Datazoom. You can check that this is working correctly by launching your app and checking the Network tab of your browser to see if logs are being pushed to Datazoom.
Connecting Datazoom to third-party data visualizers
Once the data is flowing to Datazoom, the next step is to use one of their connectors to deliver the data to a visualizer. Datazoom supports delivering to many tools including Splunk, Datadog, and AWS S3.
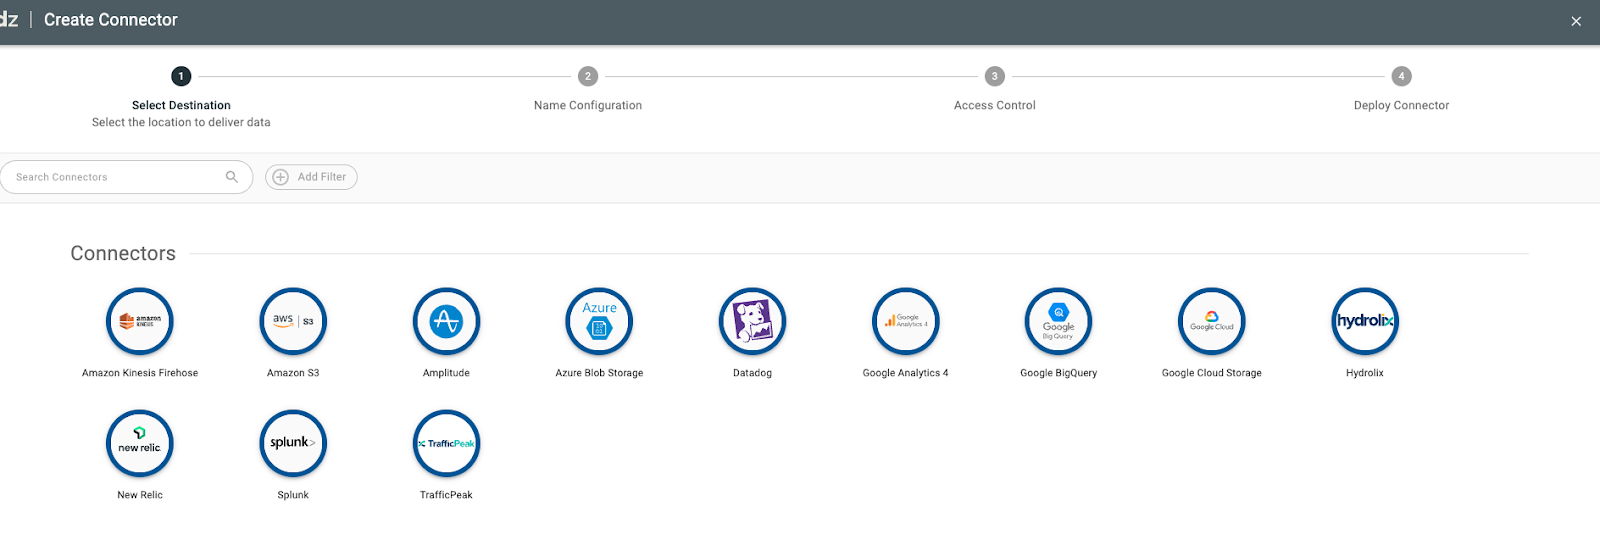
For example, Datazoom has an official Datadog integration which I connected for aggregating client data across my web apps. You can read more about the various supported platforms on Datazoom’s documentation.
Collectors and Connectors are organized by “Data Pipes” which control which data flows where. You can create a pipe by joining one-to-many Collectors with one-to-many Connectors. In my case, I wanted to aggregate the client-side data created by three web apps by delivering it all to Datadog as shown below:
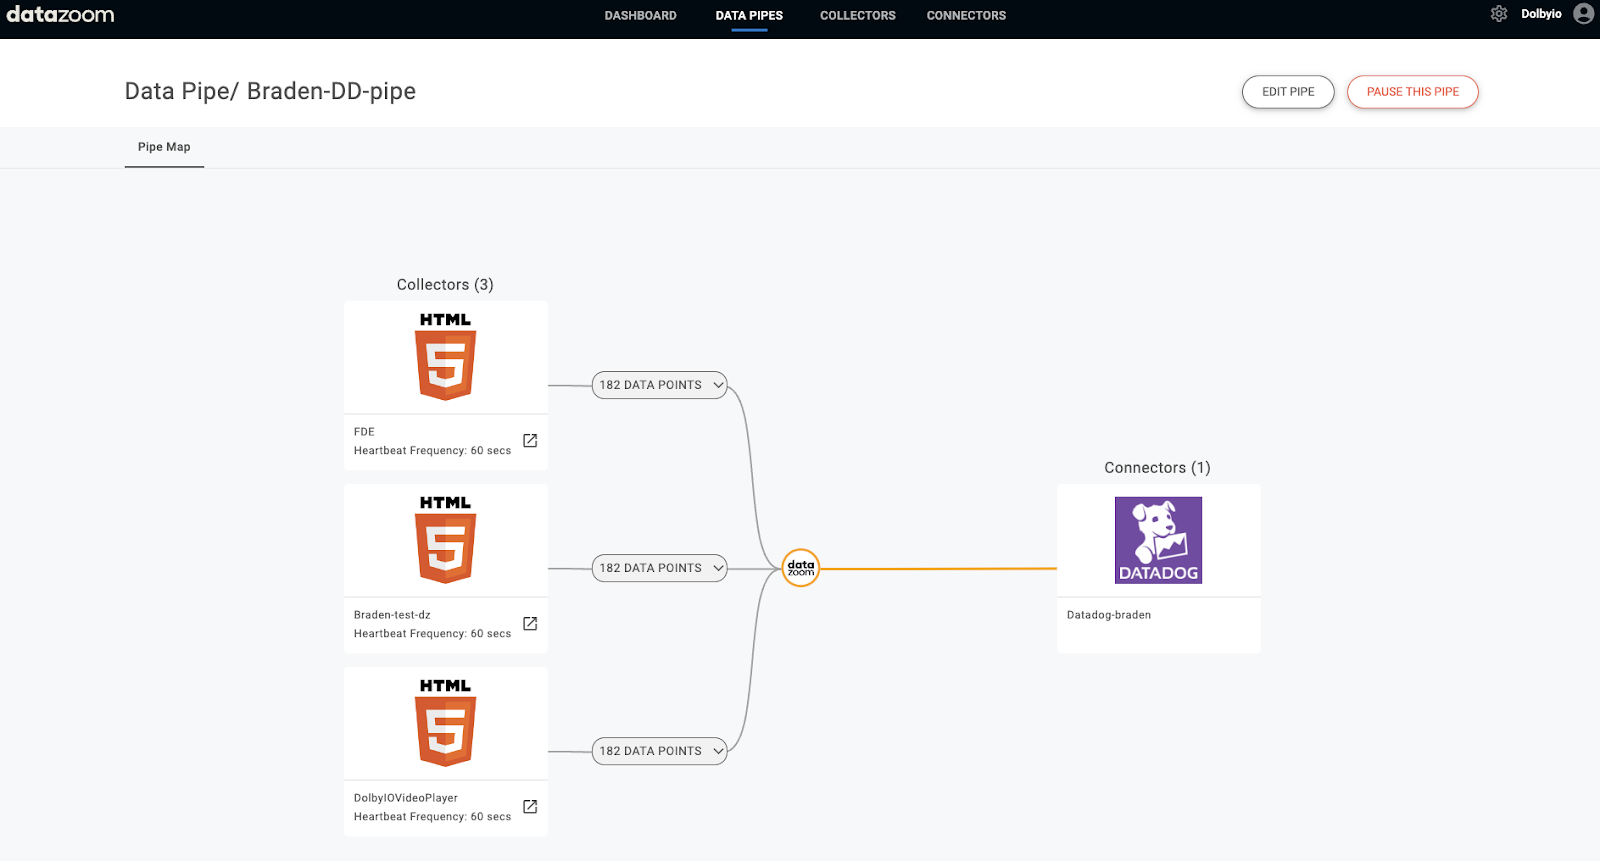
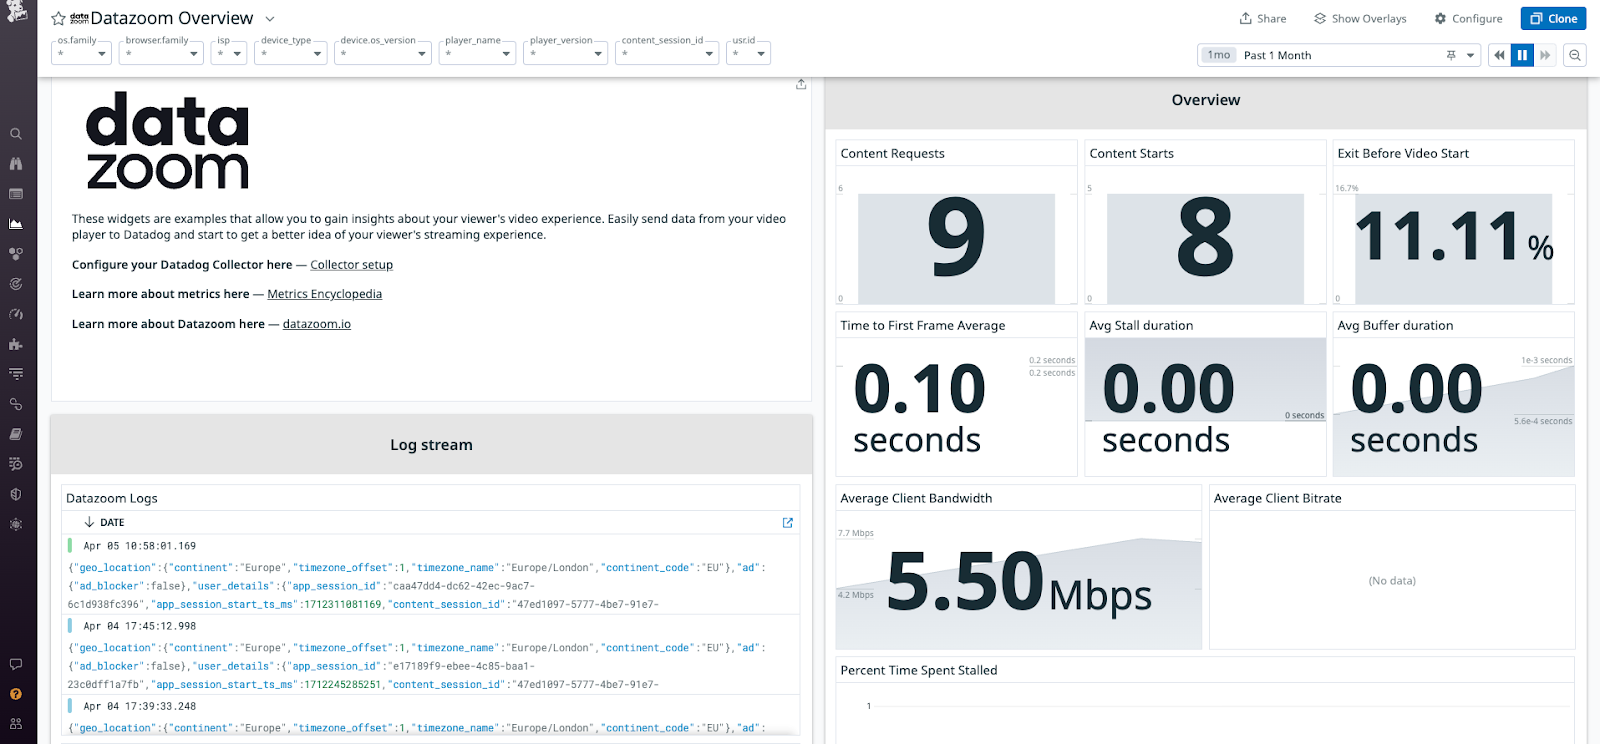
Once connected the data will begin flowing and populating the visualizer of your choice, which in my case is Datadog.
What kind of data are we extracting?
With the Collectors, Connectors, and Pipe defined, client data should begin flowing from your app to your dashboard. Included below is an example of the payload being delivered via the Datazoom collector (sensitive information redacted):
[
    {
        "event": {
            "metrics": {
                "engagement_duration_ms": 11653618,
                "num_ad_plays": 0,
                "num_content_plays": 23,
                "num_errors": 0,
                "num_errors_ads": 0,
                "num_errors_content": 0,
                "num_requests_content": 23,
                "bandwidth_kbps": 4200,
                "buffer_duration_ms": 0,
                "buffer_duration_ads_ms": 0,
                "buffer_duration_content_ms": 0,
                "buffer_length_ms": 0,
                "content_session_start_ts_ms": 1712167309643,
                "pause_duration_ms": 0,
                "pause_duration_ads_ms": 0,
                "pause_duration_content_ms": 0,
                "playback_duration_ms": 2640,
                "playback_duration_ads_ms": 0,
                "playback_duration_content_ms": 2640,
                "playback_rate": 1,
                "player_state": "playing",
                "player_viewable": true,
                "player_viewable_percent": 100,
                "playhead_position_sec": 2.686,
                "rendition_height": 1080,
                "rendition_name": "1080p",
                "rendition_width": 1920,
                "stall_count": 0,
                "stall_count_ads": 0,
                "stall_count_content": 0,
                "stall_duration_ms": 0,
                "stall_duration_ads_ms": 0,
                "stall_duration_content_ms": 0,
                "time_since_last_ad_break_start_ms": 0,
                "time_since_last_ad_completed_ms": 0,
                "time_since_last_buffer_start_ms": 2640,
                "time_since_last_buffer_start_ad_ms": 0,
                "time_since_last_buffer_start_content_ms": 2640,
                "time_since_last_heartbeat_ms": 0,
                "time_since_last_milestone_ad_ms": 0,
                "time_since_last_milestone_content_ms": 0,
                "time_since_last_pause_ms": 0,
                "time_since_last_rendition_change_ms": 600,
                "time_since_last_request_ad_ms": 0,
                "time_since_last_seek_start_ms": 0,
                "time_since_last_stall_start_ms": 0,
                "time_since_last_stall_start_ad_ms": 0,
                "time_since_last_stall_start_content_ms": 0,
                "time_since_last_started_ad_ms": 0,
                "time_since_request_content_ms": 2641,
                "time_since_started_content_ms": 2640,
                "volume_level_percent": 100,
                "event_count": 591
            },
            "attributes": {
                "abs_shift": "up"
            },
            "type": "rendition_change",
            "timestamp": 1712167312284
        },
        "configuration_id": "REDACTED FOR PUBLIC BLOG",
        "connector_list": "dz-connector-splunk,dz-connector-kinesis-firehose,dz-connector-datadog",
        "customer_code": "REDACTED FOR PUBLIC BLOG",
        "user_details": {
            "app_session_id": "REDACTED FOR PUBLIC BLOG",
            "app_session_start_ts_ms": 1712155658666,
            "client_ip": "REDACTED FOR PUBLIC BLOG",
            "user_agent": "REDACTED FOR PUBLIC BLOG"
        },
        "player": {
            "player_name": "HTML5 Native Player",
            "autostart": true,
            "default_muted": true,
            "default_playback_rate": 1,
            "fullscreen": false,
            "loop": false,
            "muted": true,
            "preload": "none",
            "ready_state": 4,
            "streaming_protocol": ""
        },
        "device": {
            "browser_name": "Chrome",
            "browser_height": 1334,
            "browser_version": "123.0.0.0",
            "browser_width": 1904,
            "cookies_enabled": true,
            "device_id": "REDACTED FOR PUBLIC BLOG",
            "device_type": "pc",
            "os_name": "Mac OS X",
            "os_version": "10.15.7"
        },
        "geo_location": {
            "city": "London",
            "country": "United Kingdom",
            "country_code": "GB",
            "latitude": REDACTED FOR PUBLIC BLOG,
            "longitude": REDACTED FOR PUBLIC BLOG,
            "postal_code": "REDACTED FOR PUBLIC BLOG",
            "region": "England",
            "region_code": "ENG",
            "continent": "Europe",
            "continent_code": "EU",
            "district": "",
            "timezone_name": "Europe/London",
            "timezone_offset": 1
        },
        "network": {
            "asn": "REDACTED FOR PUBLIC BLOG",
            "asn_org": "REDACTED FOR PUBLIC BLOG",
            "isp": "REDACTED FOR PUBLIC BLOG",
            "mobile_connection": false
        },
        "ops_metadata": {
            "server_ts_offset_ms": 208,
            "player_context_id": "REDACTED FOR PUBLIC BLOG",
            "collector_observability": [
                {
                    "time": 1712167311684,
                    "metric_name": "process_duration_ms",
                    "dimension": {
                        "target": "log",
                        "attempt_count": 1,
                        "status_code": 200
                    },
                    "metric_value": 171
                },
                {
                    "time": 1712167311684,
                    "metric_name": "queue_duration_ms",
                    "dimension": {
                        "target": "log"
                    },
                    "metric_value": 56
                },
                {
                    "time": 1712167311740,
                    "metric_name": "send_duration_ms",
                    "dimension": {
                        "target": "log",
                        "attempt_count": 1,
                        "status_code": 200
                    },
                    "metric_value": 115
                },
                {
                    "time": 1712167311740,
                    "metric_name": "call_duration_ms",
                    "dimension": {
                        "target": "log",
                        "attempt": 1,
                        "status_code": 200
                    },
                    "metric_value": 115
                }
            ]
        },
        "page": {
            "dz_sdk_version": "2.25.0",
            "page_title": "Dolby.io Real-time Streaming - Datazoom",
            "page_url": "http://127.0.0.1:5500/new%20demo/index.html",
            "referrer_url": "http://127.0.0.1:5500/new%20demo/index.html",
            "site_domain": "127.0.0.1"
        },
        "ad": {
            "ad_blocker": false
        },
        "video": {
            "media_type": "content",
            "player_height": 360,
            "player_width": 640,
            "source": ""
        },
        "custom": {
            "webRTCStats": {
                "audio": {
                    "inbounds": [
                        {
                            "mimeType": "audio/opus",
                            "timestamp": 1712167311343.687,
                            "totalBytesReceived": 23460,
                            "totalPacketsReceived": 94,
                            "totalPacketsLost": 0,
                            "jitter": 0.004,
                            "id": "IT01A660905362",
                            "mid": "1",
                            "trackIdentifier": "REDACTED FOR PUBLIC BLOG",
                            "bitrate": 100952,
                            "packetsLostRatioPerSecond": 0,
                            "packetsLostDeltaPerSecond": 0
                        }
                    ],
                    "outbounds": []
                },
                "video": {
                    "inbounds": [
                        {
                            "mimeType": "video/H264",
                            "framesPerSecond": 20,
                            "frameHeight": 540,
                            "frameWidth": 960,
                            "timestamp": 1712167311343.687,
                            "totalBytesReceived": 256532,
                            "totalPacketsReceived": 1057,
                            "totalPacketsLost": 0,
                            "jitter": 0.003,
                            "id": "REDACTED FOR PUBLIC BLOG",
                            "mid": "0",
                            "trackIdentifier": "REDACTED FOR PUBLIC BLOG",
                            "bitrate": 1244344,
                            "packetsLostRatioPerSecond": 0,
                            "packetsLostDeltaPerSecond": 0
                        }
                    ],
                    "outbounds": []
                },
                "raw": {},
                "totalRoundTripTime": 0.031,
                "currentRoundTripTime": 0.005,
                "availableOutgoingBitrate": 300000,
                "candidateType": "prflx"
            }
        },
        "event_id": "REDACTED FOR PUBLIC BLOG"
    }
]
This data can be used to unlock a number of insights into the client experience and the audience you have engaging with your content.
Final thoughts
Client-side data is a useful feature for improving user satisfaction and retention. Dolby Millicast along with Datazoom supports an advanced level of insight into how users are interfacing with your content, helping provide you with the information to better curate an optimal streaming experience. To learn more about client-side monitoring for Dolby Millicast, dive into our solution brief.
To learn more about Dolby Millicast, check out our Documentation, Blogs, and feel free to chat with the team to learn more about the platform and how we can help enable you to build a high-quality video experience.


")